Why Executives Need Effective Dashboards
- Facilitate quick decision-making with real-time data.
- Enhance communication by standardizing data.
- Track progress against company objectives.
Get Avery Jordan's latest insights directly to your inbox and transform your digital strategy.
Posted on: 2026-07-20
By: Avery Jordan
In an age where data drives decisions, the effectiveness of your executive dashboards can distinguish your organization from the competition. With the ability to visualize key performance indicators at a glance, executives can pivot strategies swiftly, ensuring that no opportunity for growth is missed.
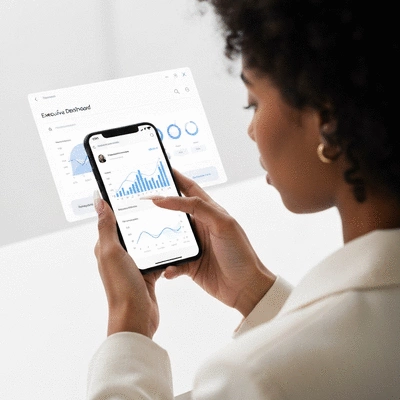
This visual outlines key considerations for creating effective and mobile-friendly executive dashboards, focusing on crucial insights for decision-makers.
In today's fast-paced business environment, executives require effective dashboards to keep track of their key performance indicators (KPIs). These dashboards not only provide a visual summary of critical data but also enable leaders to make informed decisions quickly. At Analytics Ltd, we believe that a well-designed executive dashboard is more than just a collection of numbers—it's a powerful tool that drives strategy and performance. For more insights on how visual data can transform decision-making, explore our guide on understanding data visualization basics.
Imagine being able to view your business's performance at a glance, identifying areas of strength and opportunities for growth. This is why understanding the importance of these dashboards is essential for any organization aiming to thrive in a data-driven world.
Executives are often inundated with data from various sources, making it challenging to sift through all that information and find actionable insights. This is where effective dashboards come in. They help summarize vast amounts of data into clear and concise visuals that highlight the most critical aspects of business performance.
By utilizing executive dashboards, organizations can establish a single source of truth, ensuring that all stakeholders are aligned with the same metrics and goals. This alignment is crucial for strategic planning and operational efficiency.
Key performance indicators (KPIs) are measurable values that demonstrate how effectively a company is achieving its business objectives. In the context of analytics, defining the right KPIs is vital for ensuring that your dashboard provides the most relevant insights. At Analytics Ltd, we advocate for selecting KPIs that are not only measurable but also aligned with your business goals. Understanding how to align website KPIs with goals is a critical step in this process.
By focusing on these defined metrics, businesses can create a more targeted approach to reporting and decision-making, ultimately driving growth and success.
In a world where every second counts, having access to real-time data insights can give businesses a significant edge. Dashboards in Tableau allow executives to monitor their KPIs live, enabling them to respond swiftly to changes in performance metrics.
At Analytics Ltd, we believe that real-time insights not only improve decision-making but also foster a culture of accountability and performance improvement. With the right tools, your team's ability to react and adapt to data can lead to remarkable outcomes.
To maximize the effectiveness of your executive dashboard, consider incorporating user feedback regularly. This ensures that the dashboard evolves with the needs of its users and remains relevant in providing actionable insights.
In today's fast-paced business environment, mobile access to executive dashboards is no longer a luxury; it’s a necessity. As executives and decision-makers find themselves increasingly on the move, it’s crucial to ensure that your dashboards are optimized for mobile viewing. This means designing with mobility in mind, which not only enhances accessibility but also ensures that critical data remains at executives' fingertips, regardless of their location.
By taking the time to prioritize mobile-friendly features, we can ensure that stakeholders can navigate key insights smoothly. Here are a few essential considerations when optimizing your executive dashboard for mobile devices:
Each of these elements contributes to a better mobile experience, allowing for quicker decision-making without compromising data integrity.
Testing the responsiveness of your dashboard is crucial. As a user of Tableau myself, I can attest that the platform provides tools that help simulate mobile environments effectively. It’s important to check how your dashboard appears on various devices, including tablets and smartphones. Here are a few steps to ensure responsiveness:
By focusing on these testing methods, we can refine our dashboards to meet the needs of mobile users, ensuring they have access to vital data wherever they are!
Interactivity is a key component of any dashboard, especially when accessed on mobile devices. We want to ensure that users not only view the data but interact with it as well. Here are a few ways to enhance interactivity:
These interactive features enhance user engagement and ensure that executives can make informed decisions quickly, even while they're on the go. Remember, the easier we make it for users to interact with the data, the more likely they are to rely on those insights for strategic decisions. For further reading on making your data useful, consider exploring effective data visualization techniques.
A: Executive dashboards consolidate vast amounts of data into clear, concise visuals to help leaders track key performance indicators (KPSs), facilitate quick decision-making, and monitor progress against company objectives.
A: Defining the right KPIs is vital because it ensures that the dashboard provides the most relevant insights, aligning data tracking with specific business goals such as financial metrics, customer metrics, and operational efficiency.
A: Real-time data insights enable executives to identify trends as they happen, make proactive adjustments, reduce reporting lag time, and empower teams with current information for informed decision-making, fostering a culture of accountability.
A: Key considerations include prioritizing essential KPIs for at-a-glance viewing, utilizing responsive design frameworks, testing touch-friendly elements, and maintaining a clean, uncluttered interface to enhance accessibility and user interaction on smaller screens.
A: Interactivity can be enhanced by implementing tap-responsive filters for easy drill-down into data, utilizing gestures for intuitive navigation, and incorporating alerts or notifications for significant changes in key metrics, promoting greater user engagement.
Here is a quick recap of the important points discussed in the article: