Unlock Data-Driven Growth!

Get Avery Jordan's latest insights directly to your inbox and transform your digital strategy.

Heatmaps or Session Recordings?


Heatmaps or Session Recordings?

Posted on: 2026-07-23
By: Avery Jordan


In the digital realm, where user interaction dictates success, understanding user behavior is your compass. By employing heatmaps and session recordings, businesses can uncover crucial insights that transform data into actionable strategies. Let's delve into the essential lessons that can elevate your UX research.

A Few Things to Consider

  • Heatmaps visually represent user behavior, pinpointing the most interacted areas on your website.
  • Session recordings provide a deeper view into user journeys, highlighting pain points and drop-off locations.
  • Combining heatmaps and session recordings validates assumptions about user behavior with solid data.
  • Integrating these tools into a Conversion Rate Optimization (CRO) strategy enhances user engagement and improves conversion rates.
  • Continuous iteration based on insights from these tools fosters a culture of testing and optimization.

Heatmaps vs. Session Recordings: A UX Research Comparison

Discover the core differences and combined power of heatmaps and session recordings for comprehensive user behavior analysis and conversion optimization.

Heatmaps: Visualizing Engagement

  • Click Heatmaps: Show frequent user clicks.
  • Scroll Heatmaps: Indicate scroll depth.
  • Move Heatmaps: Track mouse movements.

Quantitative insights into user attention.

Session Recordings: Understanding Journeys

  • Playback: Observe real user interactions.
  • Error ID: Spot usability issues and friction.
  • Path Analysis: Map navigation patterns.

Qualitative insights into user experience.

Understanding Heatmaps and Session Recordings in UX Research

In today’s digital landscape, understanding user behavior is essential for any business aiming to optimize its online presence. Heatmaps and session recordings are powerful tools that help us visualize how users interact with websites and applications. At Analytics Ltd, we pride ourselves on transforming complex data into actionable insights, enabling businesses to enhance their digital strategies effectively.

These tools provide valuable information that can shape the user experience (UX) and ultimately drive conversions. Let’s explore how heatmaps reveal user engagement patterns and how session recordings help us understand navigational challenges faced by users. For a deeper dive into improving your website's performance, consider learning more about understanding conversion rate optimization.

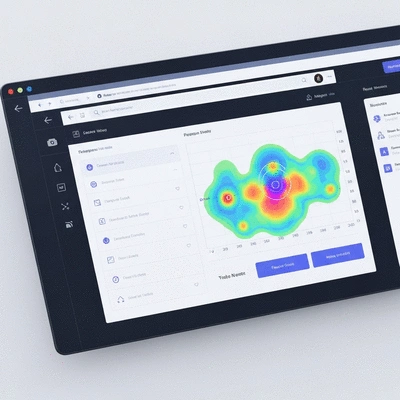
Modern dashboard with heatmap overlay showing user clicks

Defining Heatmaps: Insights into User Behavior and Interactions

Heatmaps serve as visual representations of data, using colors to indicate user interactions on a webpage. They provide a quick, intuitive way to see where users are clicking and how far they are scrolling. By analyzing heatmaps, businesses can identify key areas of interest and engagement, leading to better-informed design decisions.

  • Click Heatmaps: Show where users click most frequently.
  • Scroll Heatmaps: Indicate how far down a page users scroll.
  • Move Heatmaps: Track the mouse movements of users across the page.

By leveraging these insights, companies can refine their layouts, prioritize content placement, and ultimately enhance user engagement. At Analytics Ltd, we emphasize the importance of these metrics in crafting compelling user experiences that align with business objectives.

What Are Session Recordings and How Do They Work?

Session recordings allow businesses to watch real-time user interactions on their digital platforms. By capturing user sessions, we can gain insights into the paths users take, the points of friction they encounter, and areas where they may drop off. This qualitative data complements the quantitative insights provided by heatmaps, creating a fuller picture of user behavior.

  • Playback Capabilities: View recorded sessions to observe user interactions.
  • Error Identification: Spot where users encounter problems or confusion.
  • Path Analysis: Understand user journeys and navigation patterns.

Utilizing session recordings helps businesses identify usability issues that might not be apparent through traditional analytics alone. This holistic view of user interactions can lead to more effective data-driven decisions in optimizing the user experience. To learn more about setting up robust tracking, explore our guide on event tracking schema setup.

The Role of User Behavior Analytics in UX Research

User behavior analytics play a crucial role in UX research as they provide a comprehensive understanding of how users interact with digital platforms. By integrating both heatmaps and session recordings, we can uncover insights that drive our design strategies and boost conversion rates.

  • Informed Decision-Making: Leverage data to guide design and functionality changes.
  • Enhanced User Experience: Identify pain points and improve usability.
  • Continuous Improvement: Create a culture of testing and optimizing based on user feedback.

At Analytics Ltd, we emphasize the importance of applying these insights not just to individual pages but across the entire user journey. This approach enables businesses to create a cohesive and seamless digital experience that resonates with users, ultimately driving success in a competitive landscape.

Interactive Poll: Your Thoughts on User Behavior Tools

How do you currently gather insights about user behavior on your website? Share your preferred methods:

Frequently Asked Questions

Heatmaps are visual representations of user activity on a webpage, using colors to show interaction intensity. They help identify popular areas, user attention, and engagement levels, which are crucial for making informed design decisions and optimizing content placement.

Session recordings are video playbacks of actual user interactions on a website. They offer qualitative insights into user journeys, revealing navigation patterns, points of frustration, error encounters, and areas where users might abandon a page. This helps identify usability issues not visible through quantitative data alone.

Heatmaps provide quantitative data about *where* users interact, while session recordings offer qualitative data about *how* and *why* they interact in that way. Combining both allows for a comprehensive understanding of user behavior, validating assumptions, uncovering pain points, and leading to more effective UX improvements and conversion rate optimization (CRO) strategies.

Yes, absolutely. By identifying areas of high engagement, friction, or confusion, businesses can make data-driven changes to their website design, content, and calls to action. These optimizations directly contribute to an enhanced user experience, which in turn leads to higher conversion rates.

First, assess your specific business needs and the insights you aim to gain. Then, research various tools, compare their features and pricing, and consider utilizing free trials to see which best integrates with your existing analytics setup. Finally, deploy the chosen tools and begin gathering data to inform your UX research.

Summarizing Key Insights for Effective UX Research

As we wrap up our discussion on heatmaps and session recordings, it’s important to highlight how integrating these tools can create a powerful framework for optimizing your conversion rates. Both provide unique insights into user behavior, which can guide your decision-making process and enhance the overall user experience. By combining these data sources, you can paint a clearer picture of how users interact with your digital properties.

Here are some key insights to consider:

  • Heatmaps offer visual representations of user engagement, helping to identify the most clicked areas on your website.
  • Session recordings allow for a deeper understanding of user journeys, revealing where users encounter frustrations or drop off.
  • Using both tools together can validate findings, ensuring that your assumptions about user behavior are backed by solid data.

By synthesizing the insights from both methods, you can create a more effective user experience tailored to your audience's needs.

Integrating Both Tools for a Comprehensive CRO Approach

To truly reap the benefits of heatmaps and session recordings, it’s vital to integrate them into a cohesive conversion rate optimization (CRO) strategy. This integration allows you to leverage the strengths of each tool effectively. For instance, you might uncover that users are clicking on non-interactive elements via heatmaps, prompting a session recording analysis to understand the underlying reasons for this behavior.

Person analyzing user journey map on a tablet with data overlays

Here’s how you can integrate both tools:

  • Start with a hypothesis based on heatmap data, then validate it with session recordings.
  • Use findings from session recordings to refine your heatmap setups, focusing on the most critical user paths.
  • Continuously iterate based on insights gathered from both sources to enhance user engagement and conversion.

This cyclical approach ensures your UX research is not only data-driven but also remarkably responsive to user needs.

Final Thoughts: Making Informed Decisions Based on User Behavior

Understanding your users is paramount, and utilizing heatmaps and session recordings can significantly enhance this understanding. At Analytics Ltd, we've seen firsthand how businesses can pivot their strategies based on user behavior insights. The decision to implement these tools should stem from a clear vision of what success looks like for your organization. For leaders seeking to leverage data effectively, exploring understanding advanced analytics for leaders can provide further strategic direction.

Remember, effective UX research is not just about gathering data; it's about turning that data into actionable insights. Ensure that you regularly review and adapt your strategies based on ongoing findings to maintain a competitive edge.

Taking Action: Get Started with Heatmaps and Session Recordings Today

Next Steps: Choosing the Right Tools for Your Business Needs

As you embark on your journey to optimize your digital presence, consider the various tools available on the market. Choosing the right tools can make all the difference in how effectively you gather and analyze your data. Here are some steps to help you make informed choices:

  • Assess your specific business needs and what insights you hope to gain.
  • Research various heatmap and session recording tools, comparing features and pricing.
  • Consider trial versions to see which tools best integrate with your existing analytics setup.

Taking the time to select the right tools ensures that you have the right foundation to build upon.

Leveraging Online Surveys and User Journey Mapping for Enhanced Insights

In addition to heatmaps and session recordings, incorporating online surveys and user journey mapping can further enrich your understanding of user interactions. Surveys provide direct feedback from users, while journey mapping visualizes the entire user experience, highlighting pain points and opportunities for improvement.

Consider these strategies:

  • Deploy short, targeted surveys after key interactions to gather qualitative data.
  • Create user journey maps to visualize user flows and identify areas where users may struggle.
  • Combine these insights with your quantitative data from heatmaps and recordings for a holistic view of user behavior.

At Analytics Ltd, we believe that by leveraging these combined insights, you can create impactful changes that optimize user experiences and ultimately drive conversions. Take action today—your path to a more data-driven decision-making process starts now!

Recap of Key Points

Here is a quick recap of the important points discussed in the article:
  • Heatmaps visually represent user engagement, highlighting the most clicked areas on your website.
  • Session recordings provide insights into user journeys, revealing where users face frustrations or drop off.
  • Combining heatmaps and session recordings validates findings, ensuring your assumptions about user behavior are data-driven.
  • Integrate both tools into a cohesive conversion rate optimization (CRO) strategy for effective user engagement.
  • Regularly review and adapt strategies based on ongoing insights to maintain a competitive edge.

Subscribe & Share
Key Website KPIs for Businesses Key Website KPIs for Businesses In the digital age, the success of your business can hinge on understanding one crucial concept: KPI
GA4 Data Layer Implementation Guide GA4 Data Layer Implementation Guide Did you know that businesses leveraging structured data can significantly enhance their analytics ca
Businesses That Benefit from Web Analytics Businesses That Benefit from Web Analytics In a world where data drives decisions, web analytics stands as a cornerstone for business success.
Banner
Analytics Ltd

Your go-to resource for transforming raw digital traffic into actionable business intelligence. We help enterprises with data engineering, advanced analytics, and continuous optimization.

Trusted by product managers, marketers, and executives, our mission is to provide reliable, easy-to-follow insights backed by technical precision and strategic consultation.

Empower Your Decisions
Recent Posts
Key Website KPIs for Businesses Key Website KPIs for Businesses

In the digital age, the success of your business c

GA4 Data Layer Implementation Guide GA4 Data Layer Implementation Guide

Did you know that businesses leveraging structured

Businesses That Benefit from Web Analytics Businesses That Benefit from Web Analytics

In a world where data drives decisions, web analyt

Analytics Insights from Avery Jordan

Analysis icons created by RaftelDesign - Flaticon